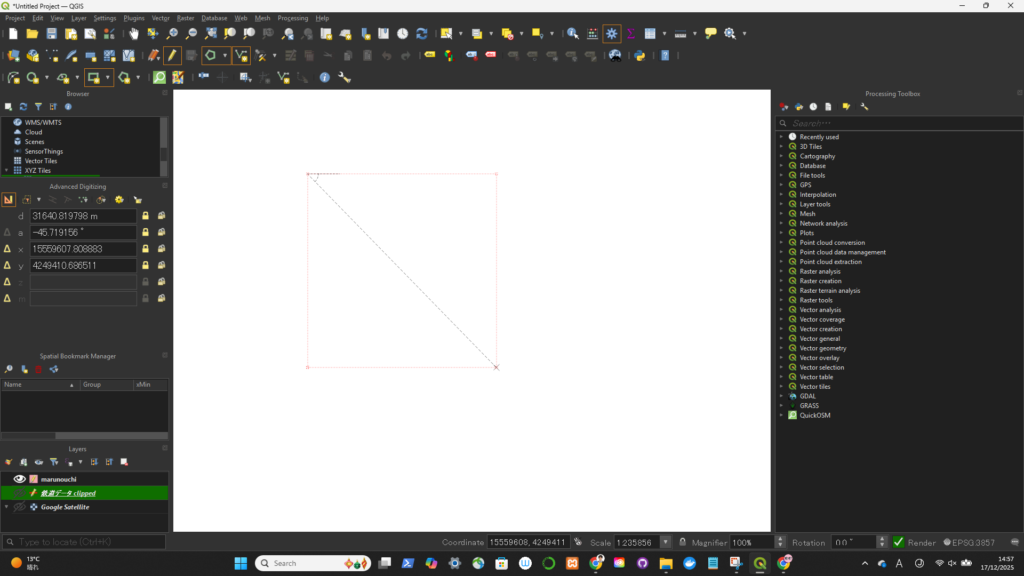
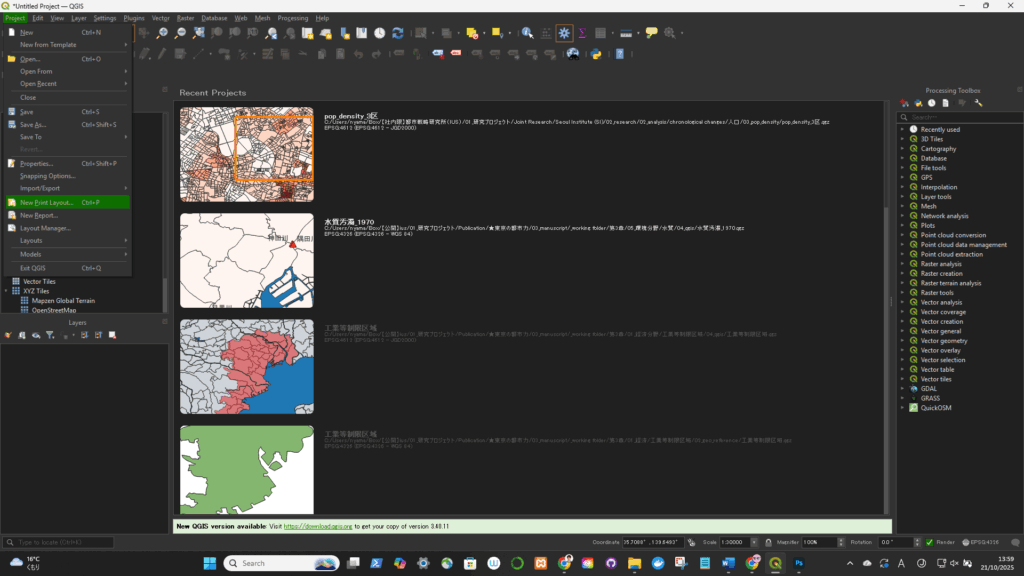
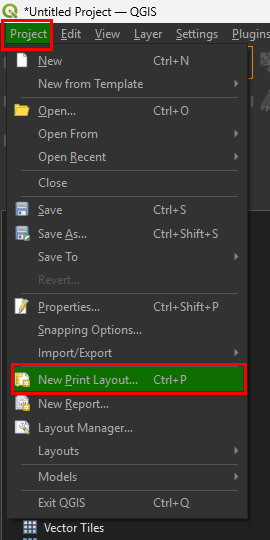
右クリックで終了

個人的な練習用のウェブサイトです
右クリックで終了
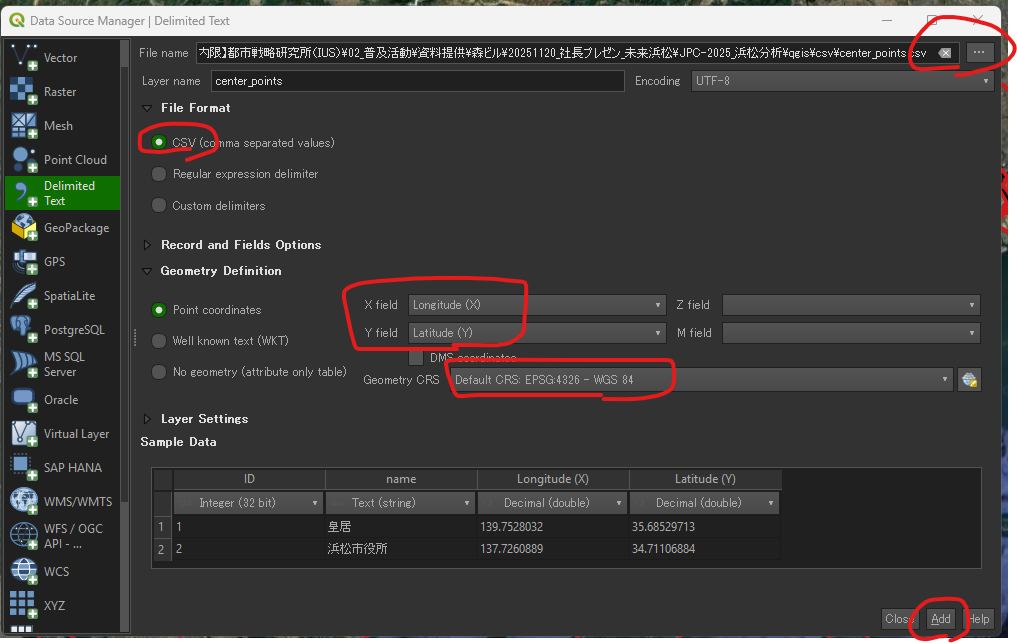
Yes, you can easily import point data (such as coordinates for a center point) from a CSV (Comma Separated Values) file into QGIS.
The specific tool in QGIS for this task is the “Add Delimited Text Layer” function.
The process requires your CSV file to have at least two columns containing the coordinates (Longitude/X and Latitude/Y).
Ensure your CSV file is correctly formatted. The headers must clearly distinguish the coordinate fields.
| ID | Longitude (X) | Latitude (Y) |
| 1 | 139.752778 | 35.684444 |
| 2 | 139.691700 | 35.689500 |
.csv file.Longitude (X)).Latitude (Y)).EPSG:4326 - WGS 84.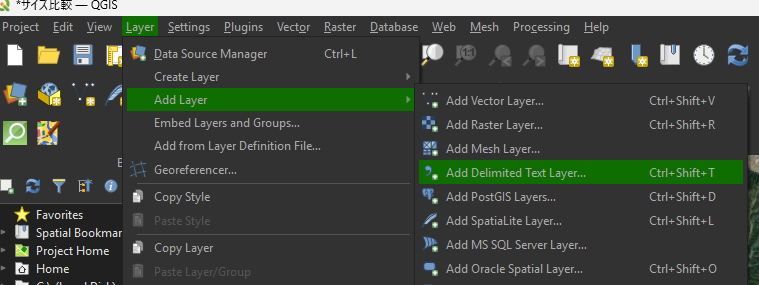
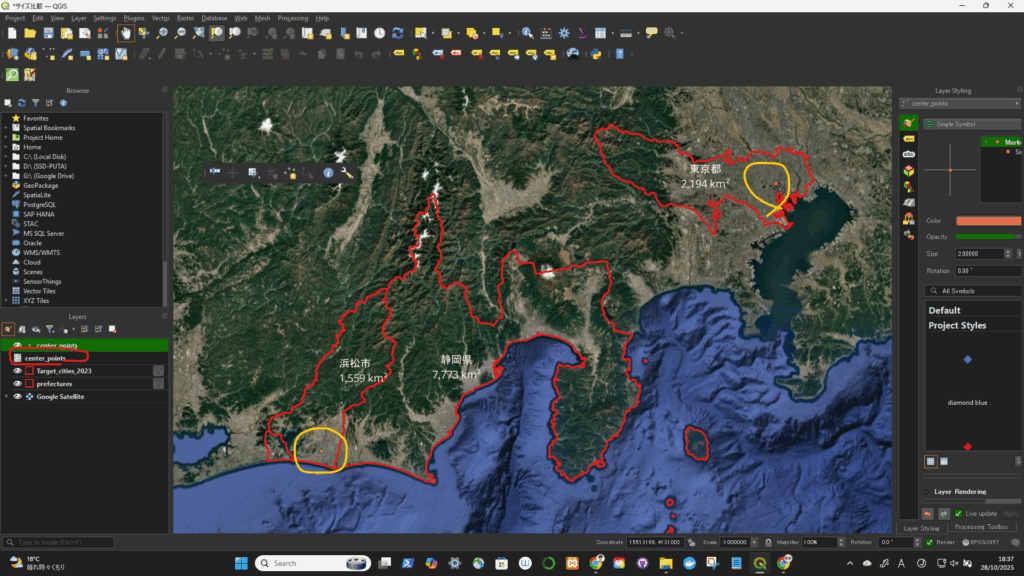
一旦、座標系(CRS)を変更(4326->3857)してから、円を描いた。degree単位をkmに変更するため。
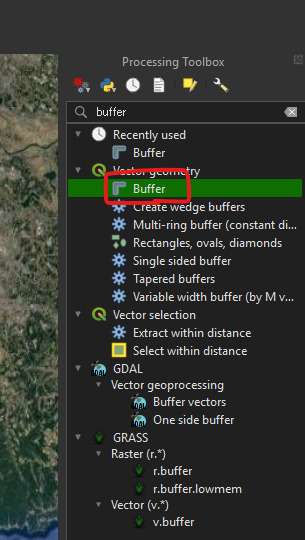
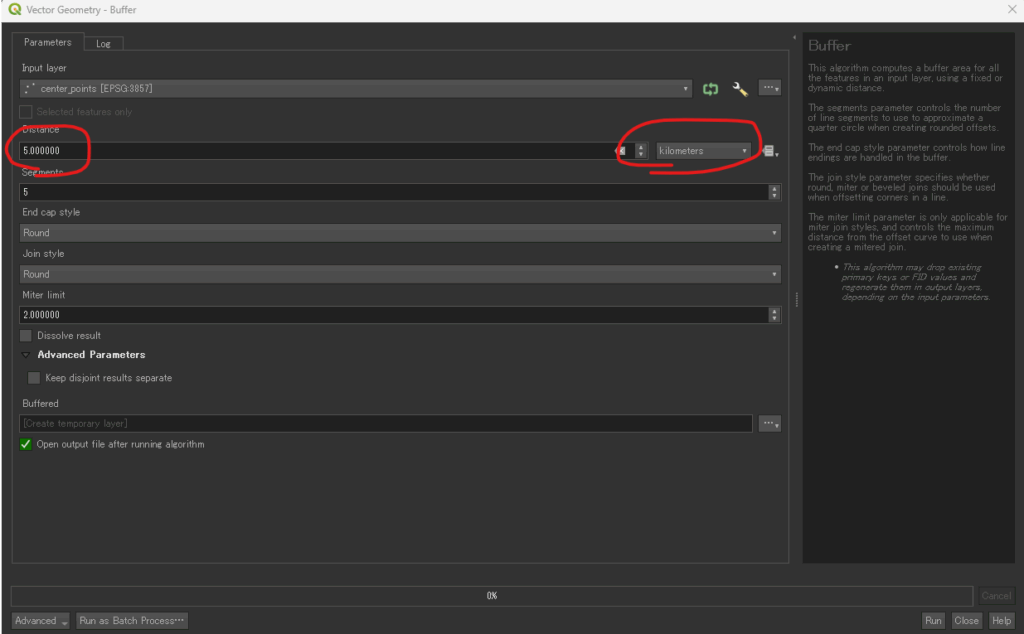
In the Buffer dialog box, set the parameters as follows to ensure accurate 5km circles:
| Parameter | Setting | Notes |
| Input layer | Select the name of the layer you imported from the CSV file (e.g., center_point). | This is the layer containing all your center points. |
| Distance | Enter the number: 5 | This is the radius value. |
| Distance unit | Select: Kilometers | Crucial: Setting the unit here tells QGIS exactly how far to calculate the buffer. |
| Segments | 5 (Default) or a higher number (e.g., 10 or 15) | This controls the smoothness of the circle’s edge. A higher number yields a smoother circle. |
| Dissolve result | Do not dissolve buffers (Uncheck/Default) | Unless you want overlapping 5km circles to merge into one single area, keep this unchecked. |
| Buffered | Click the … button and choose Save to File... | Give the new layer a meaningful name (e.g., 5km_service_areas.gpkg). |
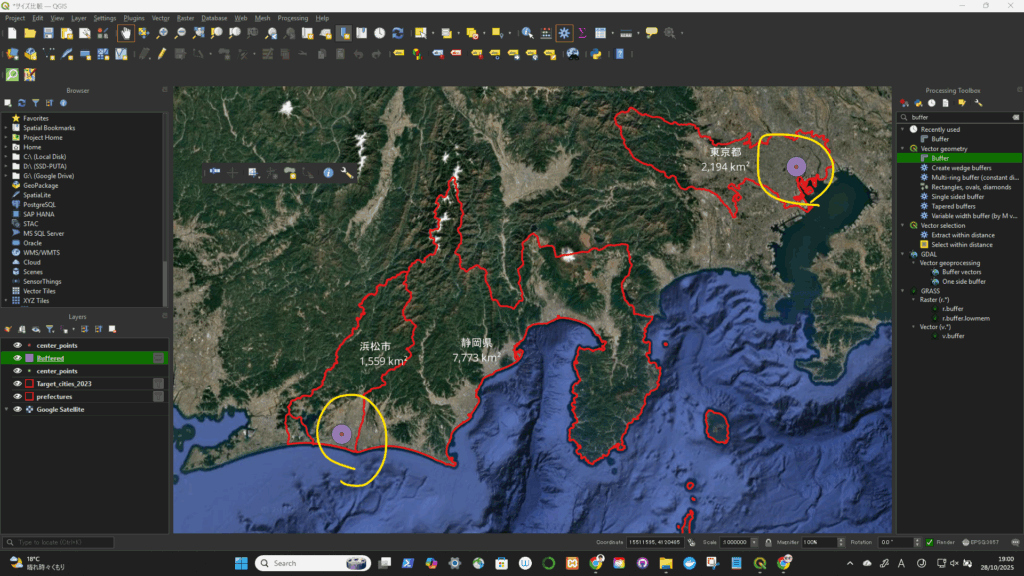
The new layer will appear on your map canvas, showing a perfect 5km radius circle around every point you imported from the CSV file.
円が描けた!
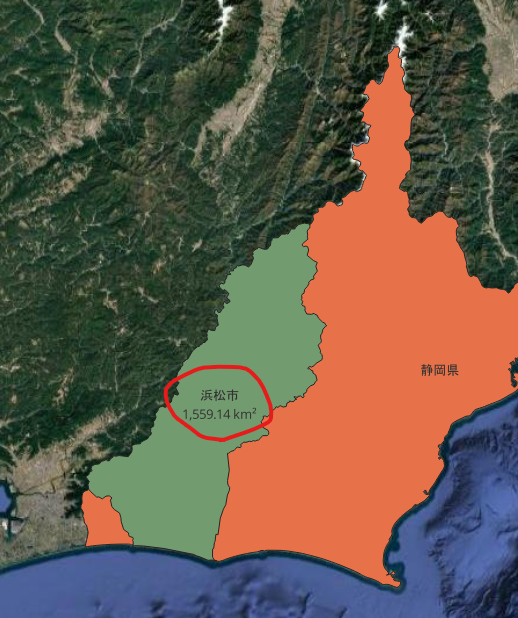
平方メートルの場合: ”<name>” || ‘\n’ || format_number( $area , 0 ) || ‘ m²’
平方キロメートルの場合: ”<name>” || ‘\n’ || format_number( $area / 1000000 , 2 ) || ‘ km²’
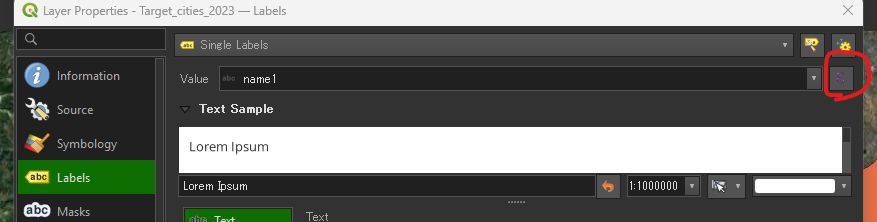
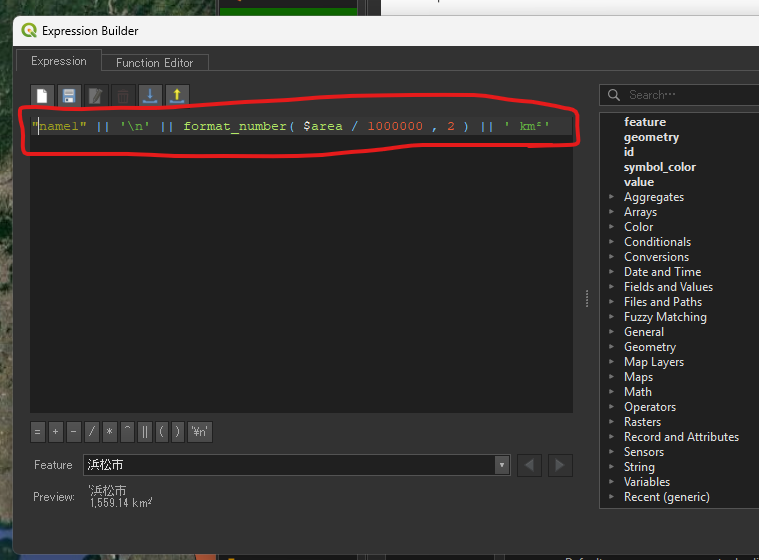
表示された!
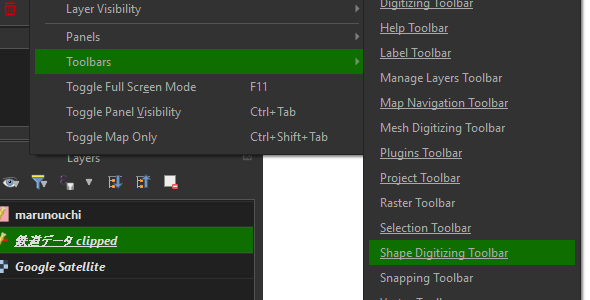
This is the simplest and most reliable method — no plugin needed.
https://tile.openstreetmap.org/{z}/{x}/{y}.png| Name | URL |
|---|---|
| OpenStreetMap (Standard) | https://tile.openstreetmap.org/{z}/{x}/{y}.png |
| Google Satellite | https://mt1.google.com/vt/lyrs=s&x={x}&y={y}&z={z} |
| Google Hybrid | https://mt1.google.com/vt/lyrs=y&x={x}&y={y}&z={z} |
| Google Roads | https://mt1.google.com/vt/lyrs=m&x={x}&y={y}&z={z} |
| Esri Satellite | https://services.arcgisonline.com/ArcGIS/rest/services/World_Imagery/MapServer/tile/{z}/{y}/{x} |
| Stamen Toner (B/W) | https://stamen-tiles.a.ssl.fastly.net/toner/{z}/{x}/{y}.png |
| Stamen Terrain | https://stamen-tiles.a.ssl.fastly.net/terrain/{z}/{x}/{y}.png |
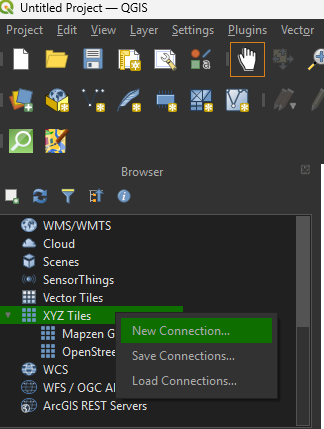
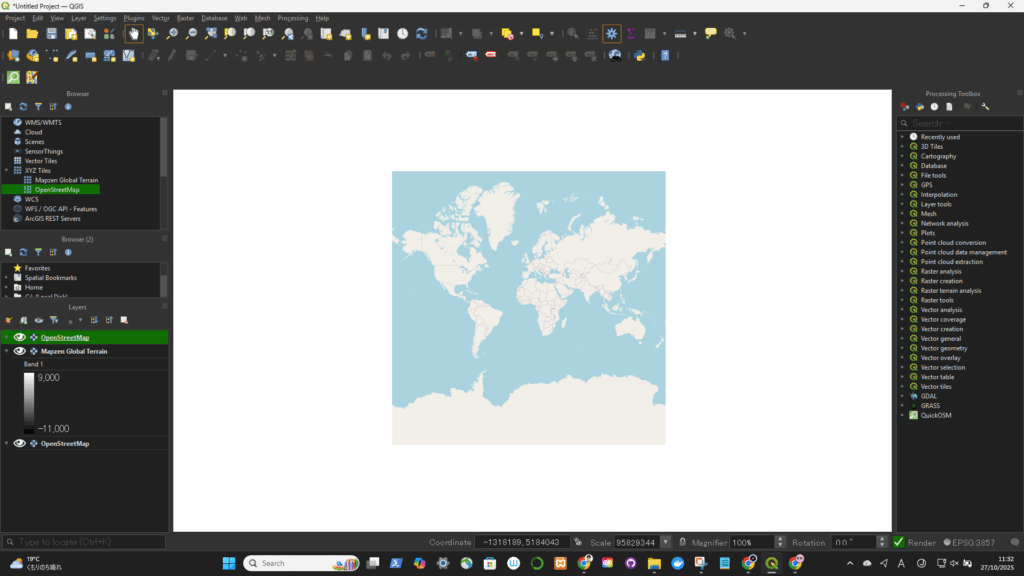
上でOpenStreetMapを選択した場合(↓)
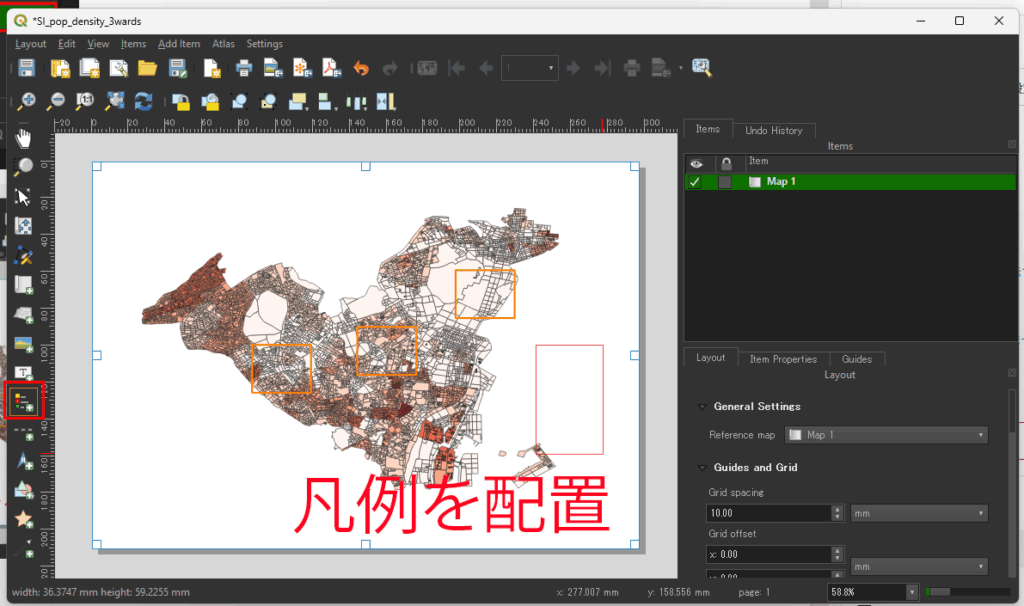
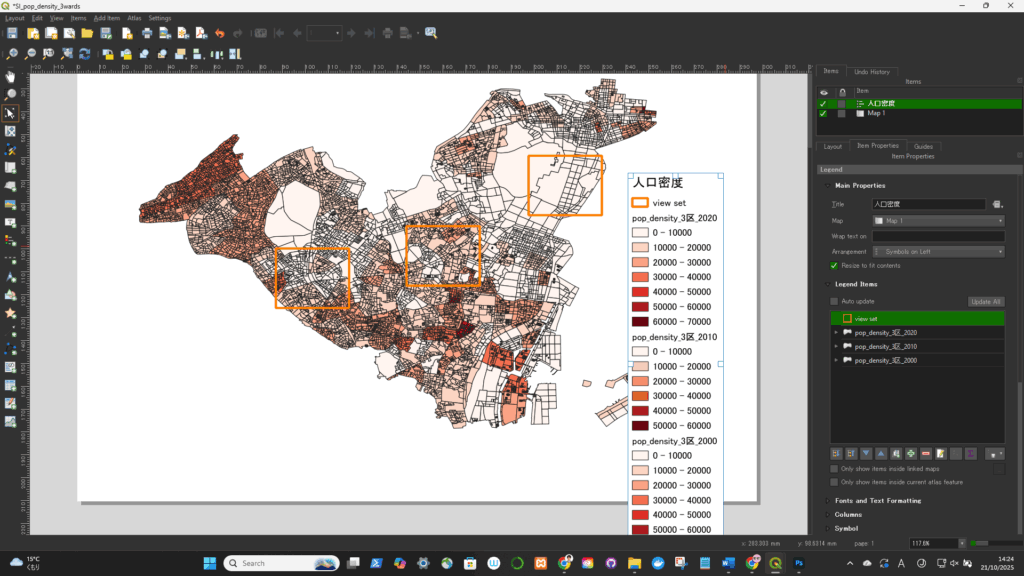
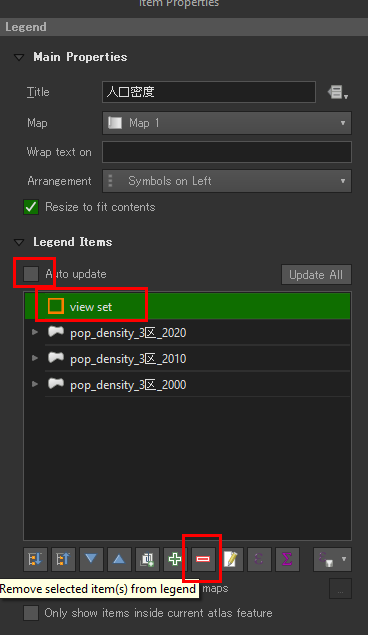
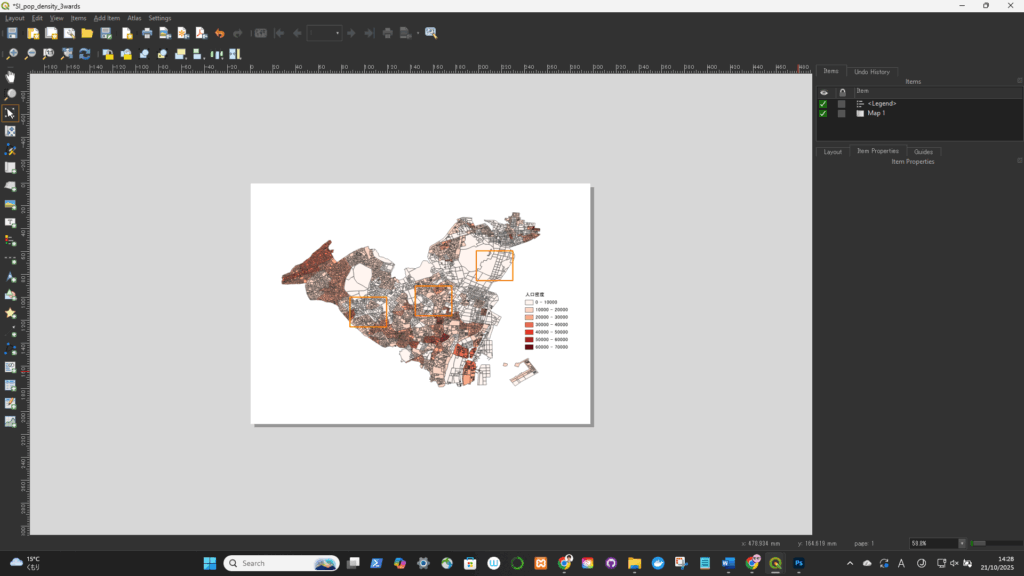
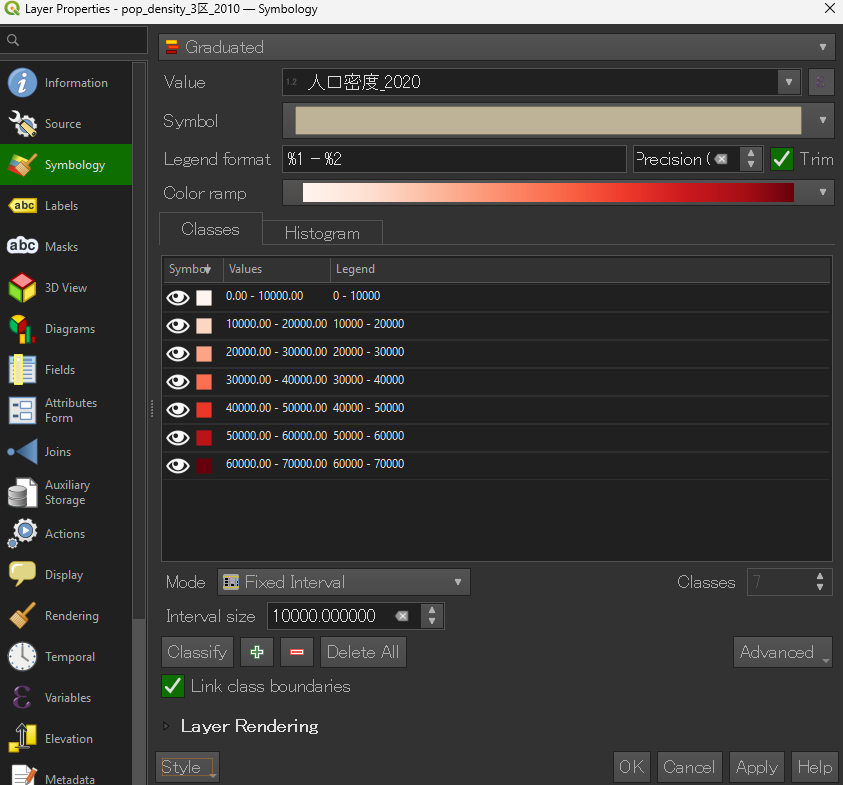
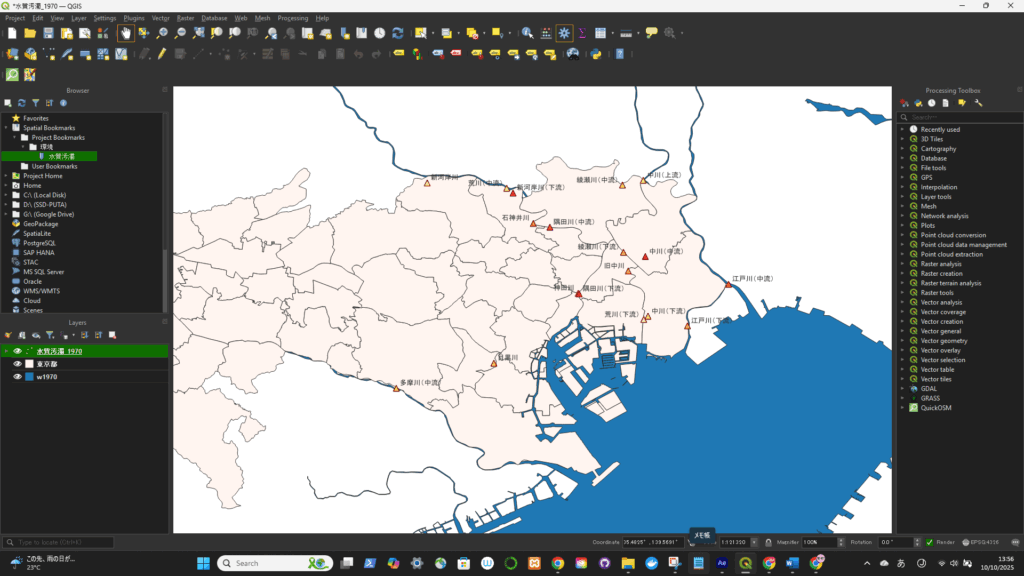
凡例が配置されたが、不要な項目があるので削除が必要
1000 に変更したい場合は、そのセルをクリックして直接入力します。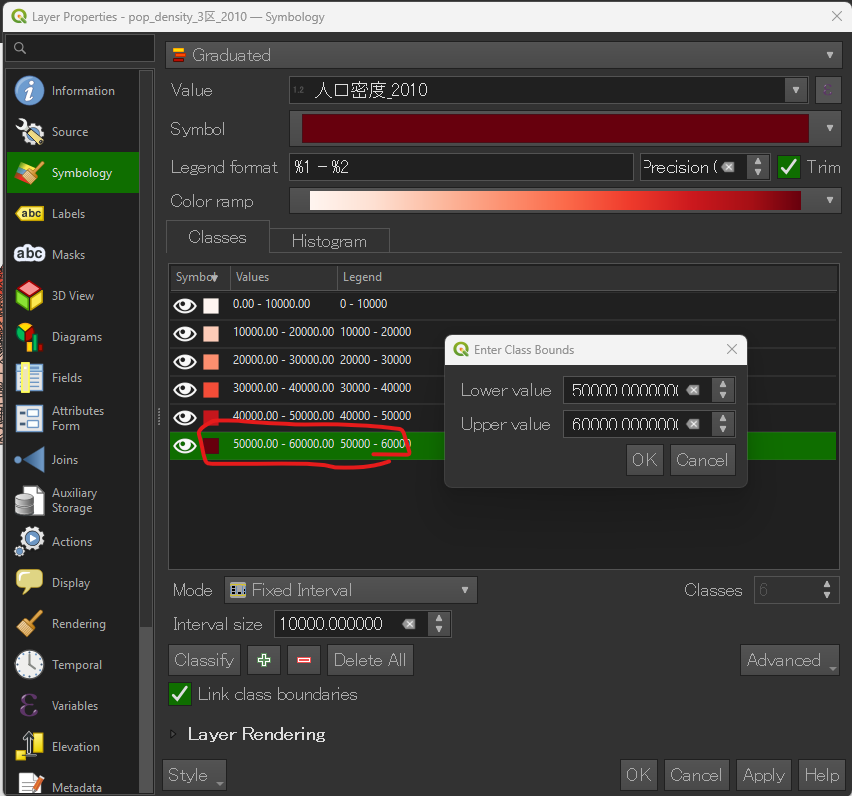
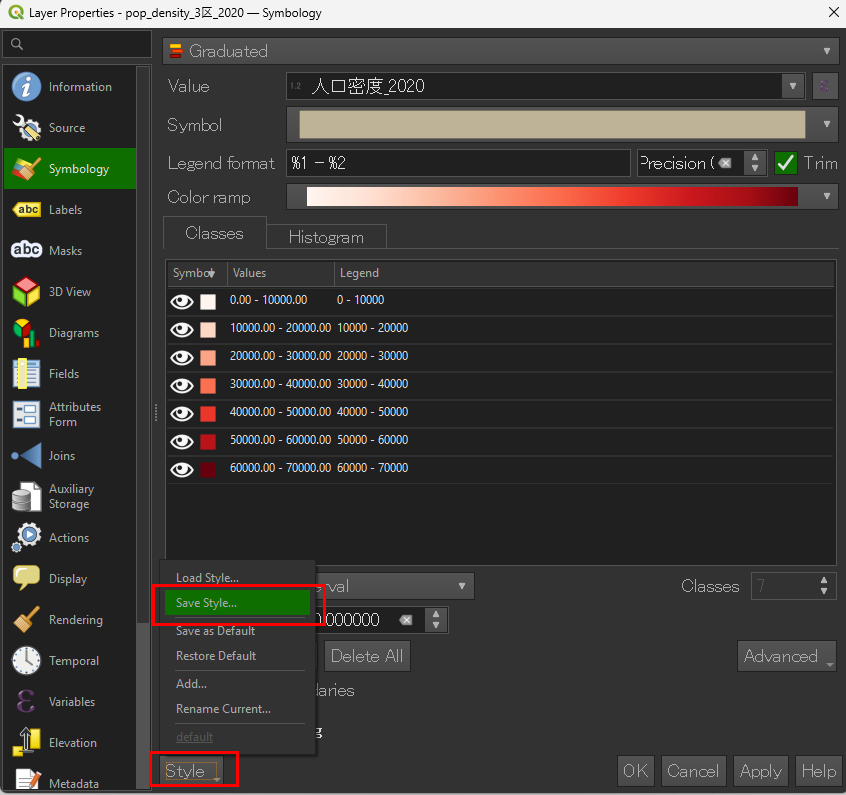
.qml ファイルを選択すると、色分け・範囲・ラベル設定が全て再現されます。■保存時
■読み込む際
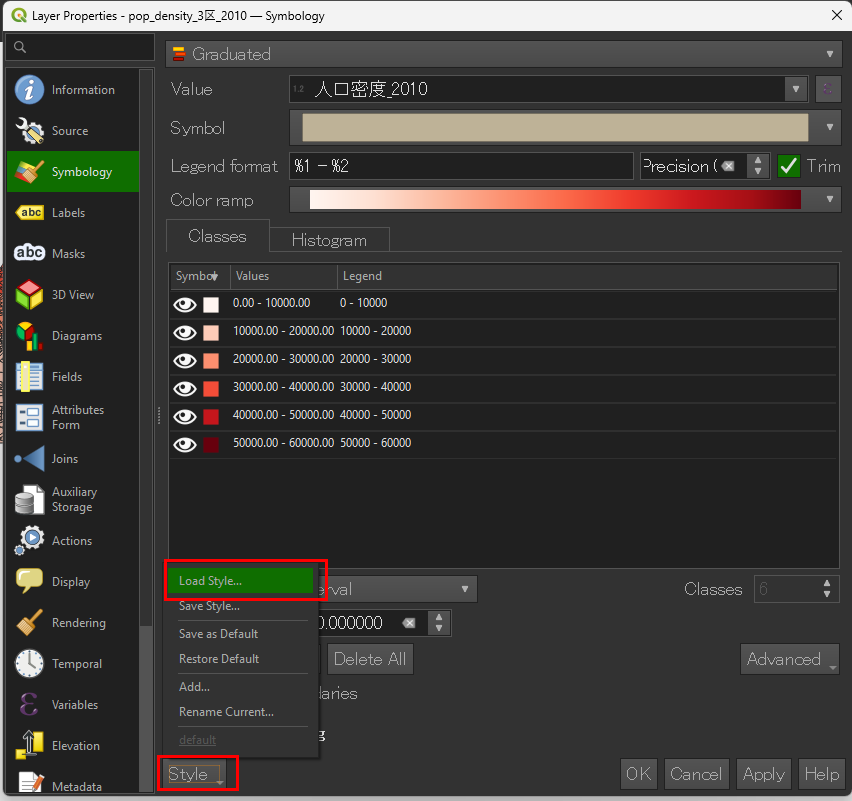
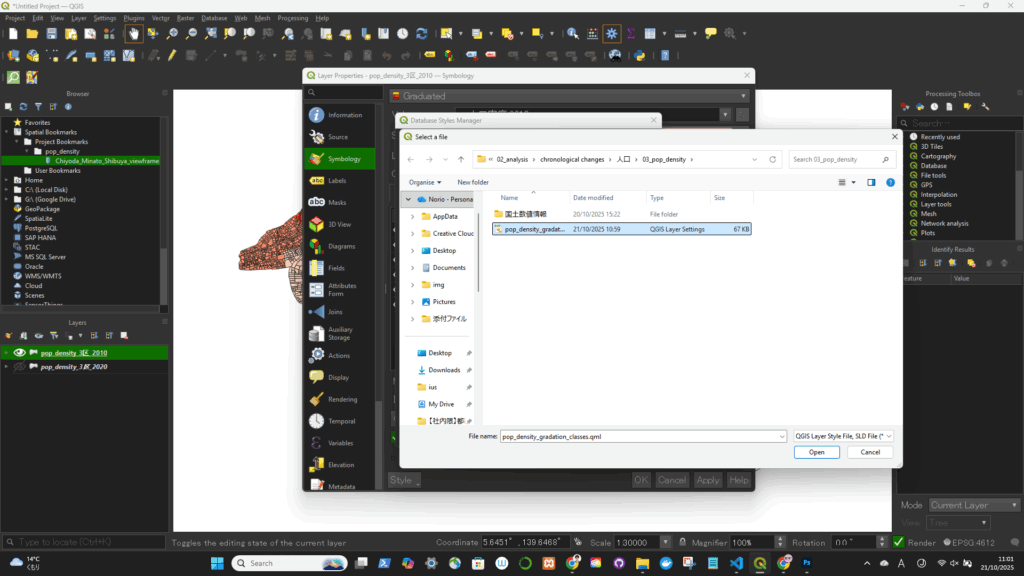
読み込めた! ※Valueも読み込んでしまっているので要修正!
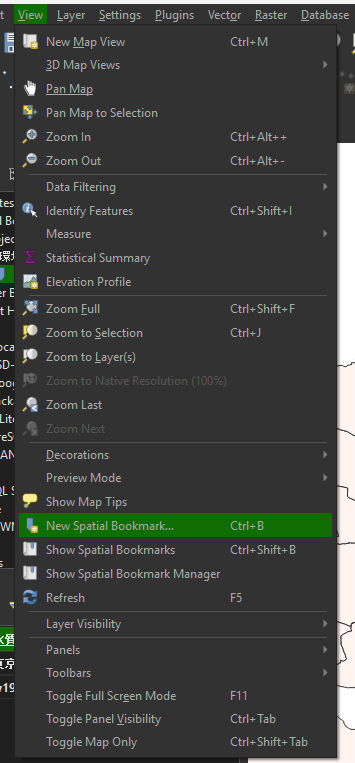
Ctrl + B).Now that bookmark will appear in:
📍 You can click it anytime to jump to exactly the same map extent — even if you’re working in a completely different dataset.
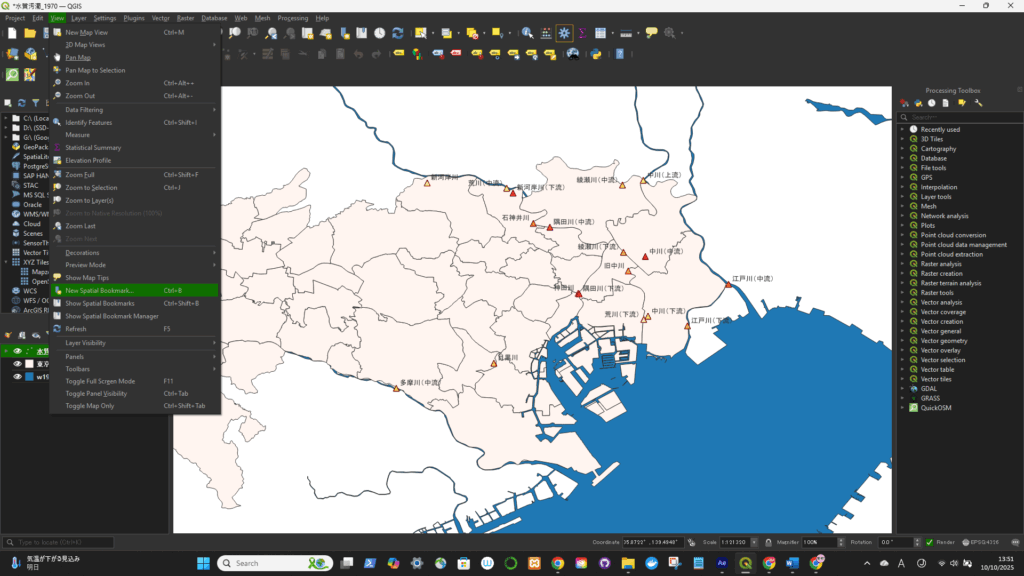
保存した後に、Show Spatial Bookmarksを選択する
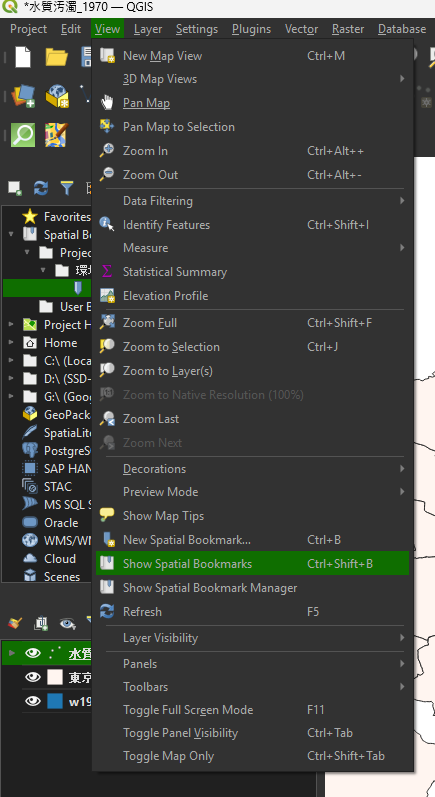

先ほど保存したBookmarkのところにフレームが戻った
元ファイルを開く(今回はEPSG:4326(WGS84)をEPSG:4612(JGD2000)に変更する)
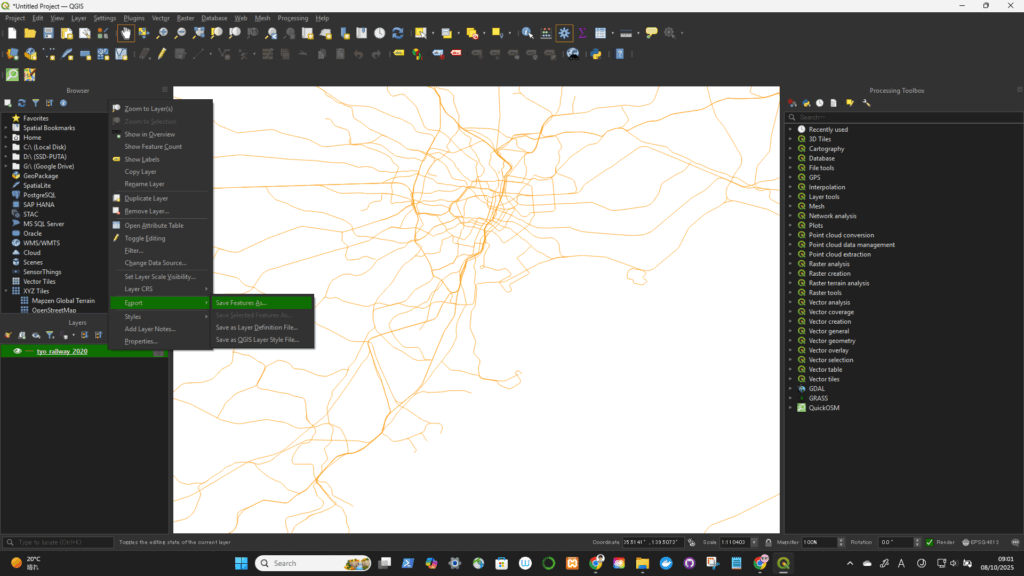
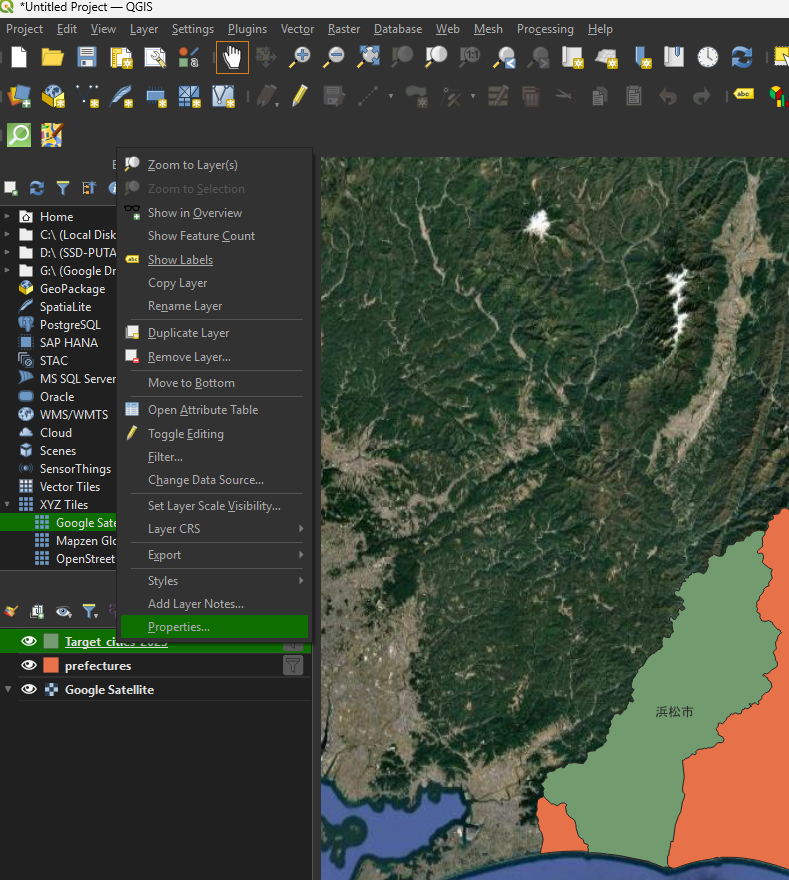
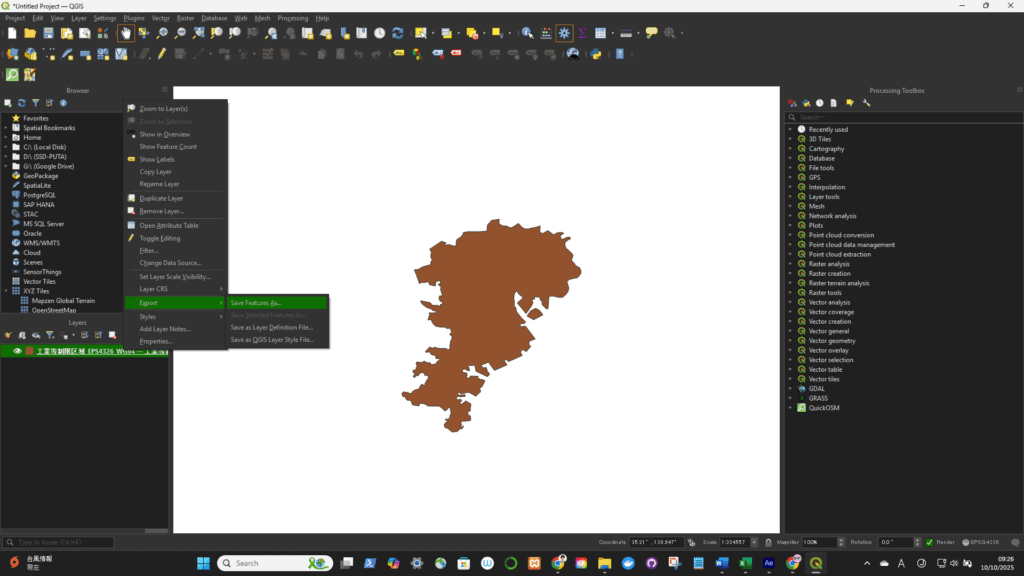
Right-click the layer in the Layers panel → select “Export” → “Save Features As…” (for vector data)
or “Export → Save As…” (for raster data).

Click OK — QGIS will create a new file in the selected CRS.
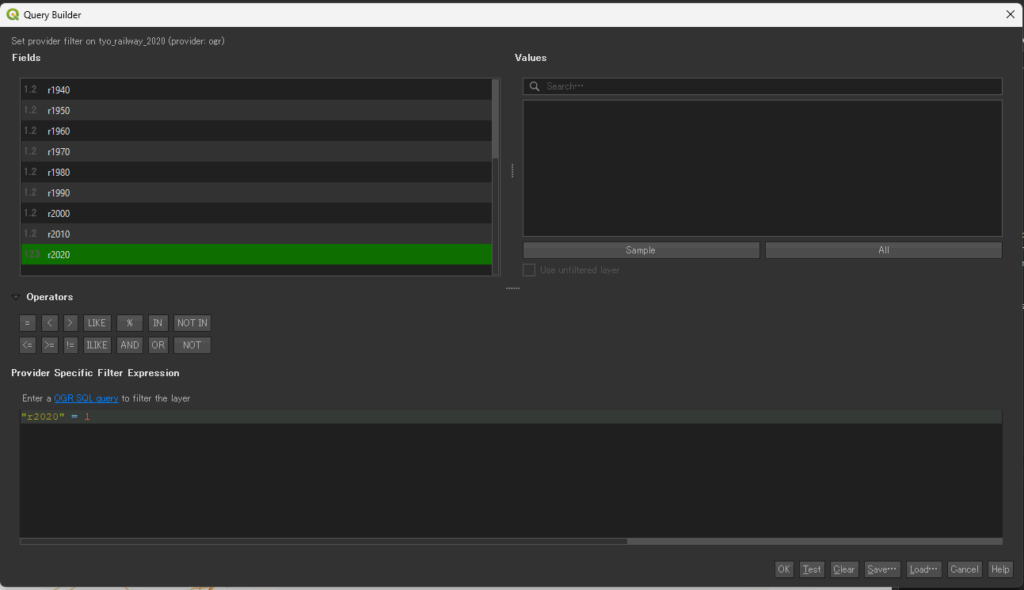
レイヤで右クリック-> filter
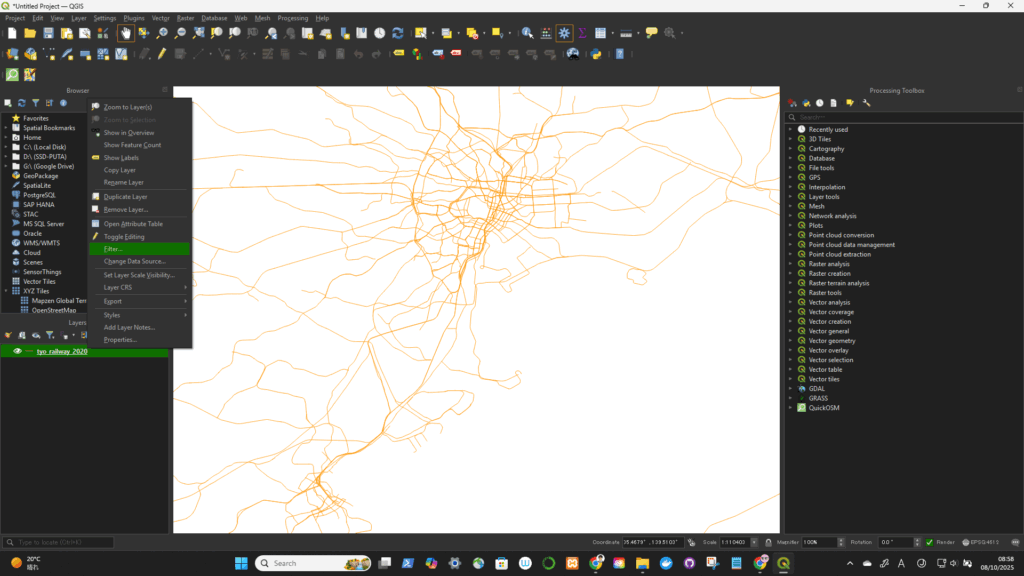
ダブルクリックでSQLに対象のフィールドを選択してSQLを記述(以下は複数の記述例)
“r2020” = 1
“S_NAME” LIKE ‘%-%’ ※S_NAMEのフィーチャーに”-“を含まない
抽出された

geojsonとしてExport